February 2026 proved to be a month of sharp
cross-currents for Indian equity markets. After an early
surge and multiple volatility spikes, the Sensex closed
the month with a modest decline of roughly 1–1.3%.
While the headline number suggests a mild pullback, the
internal churn beneath the surface was far more
dramatic, driven by sector-specific shocks, policy
surprises, shifting foreign flows, and global macro
tensions.
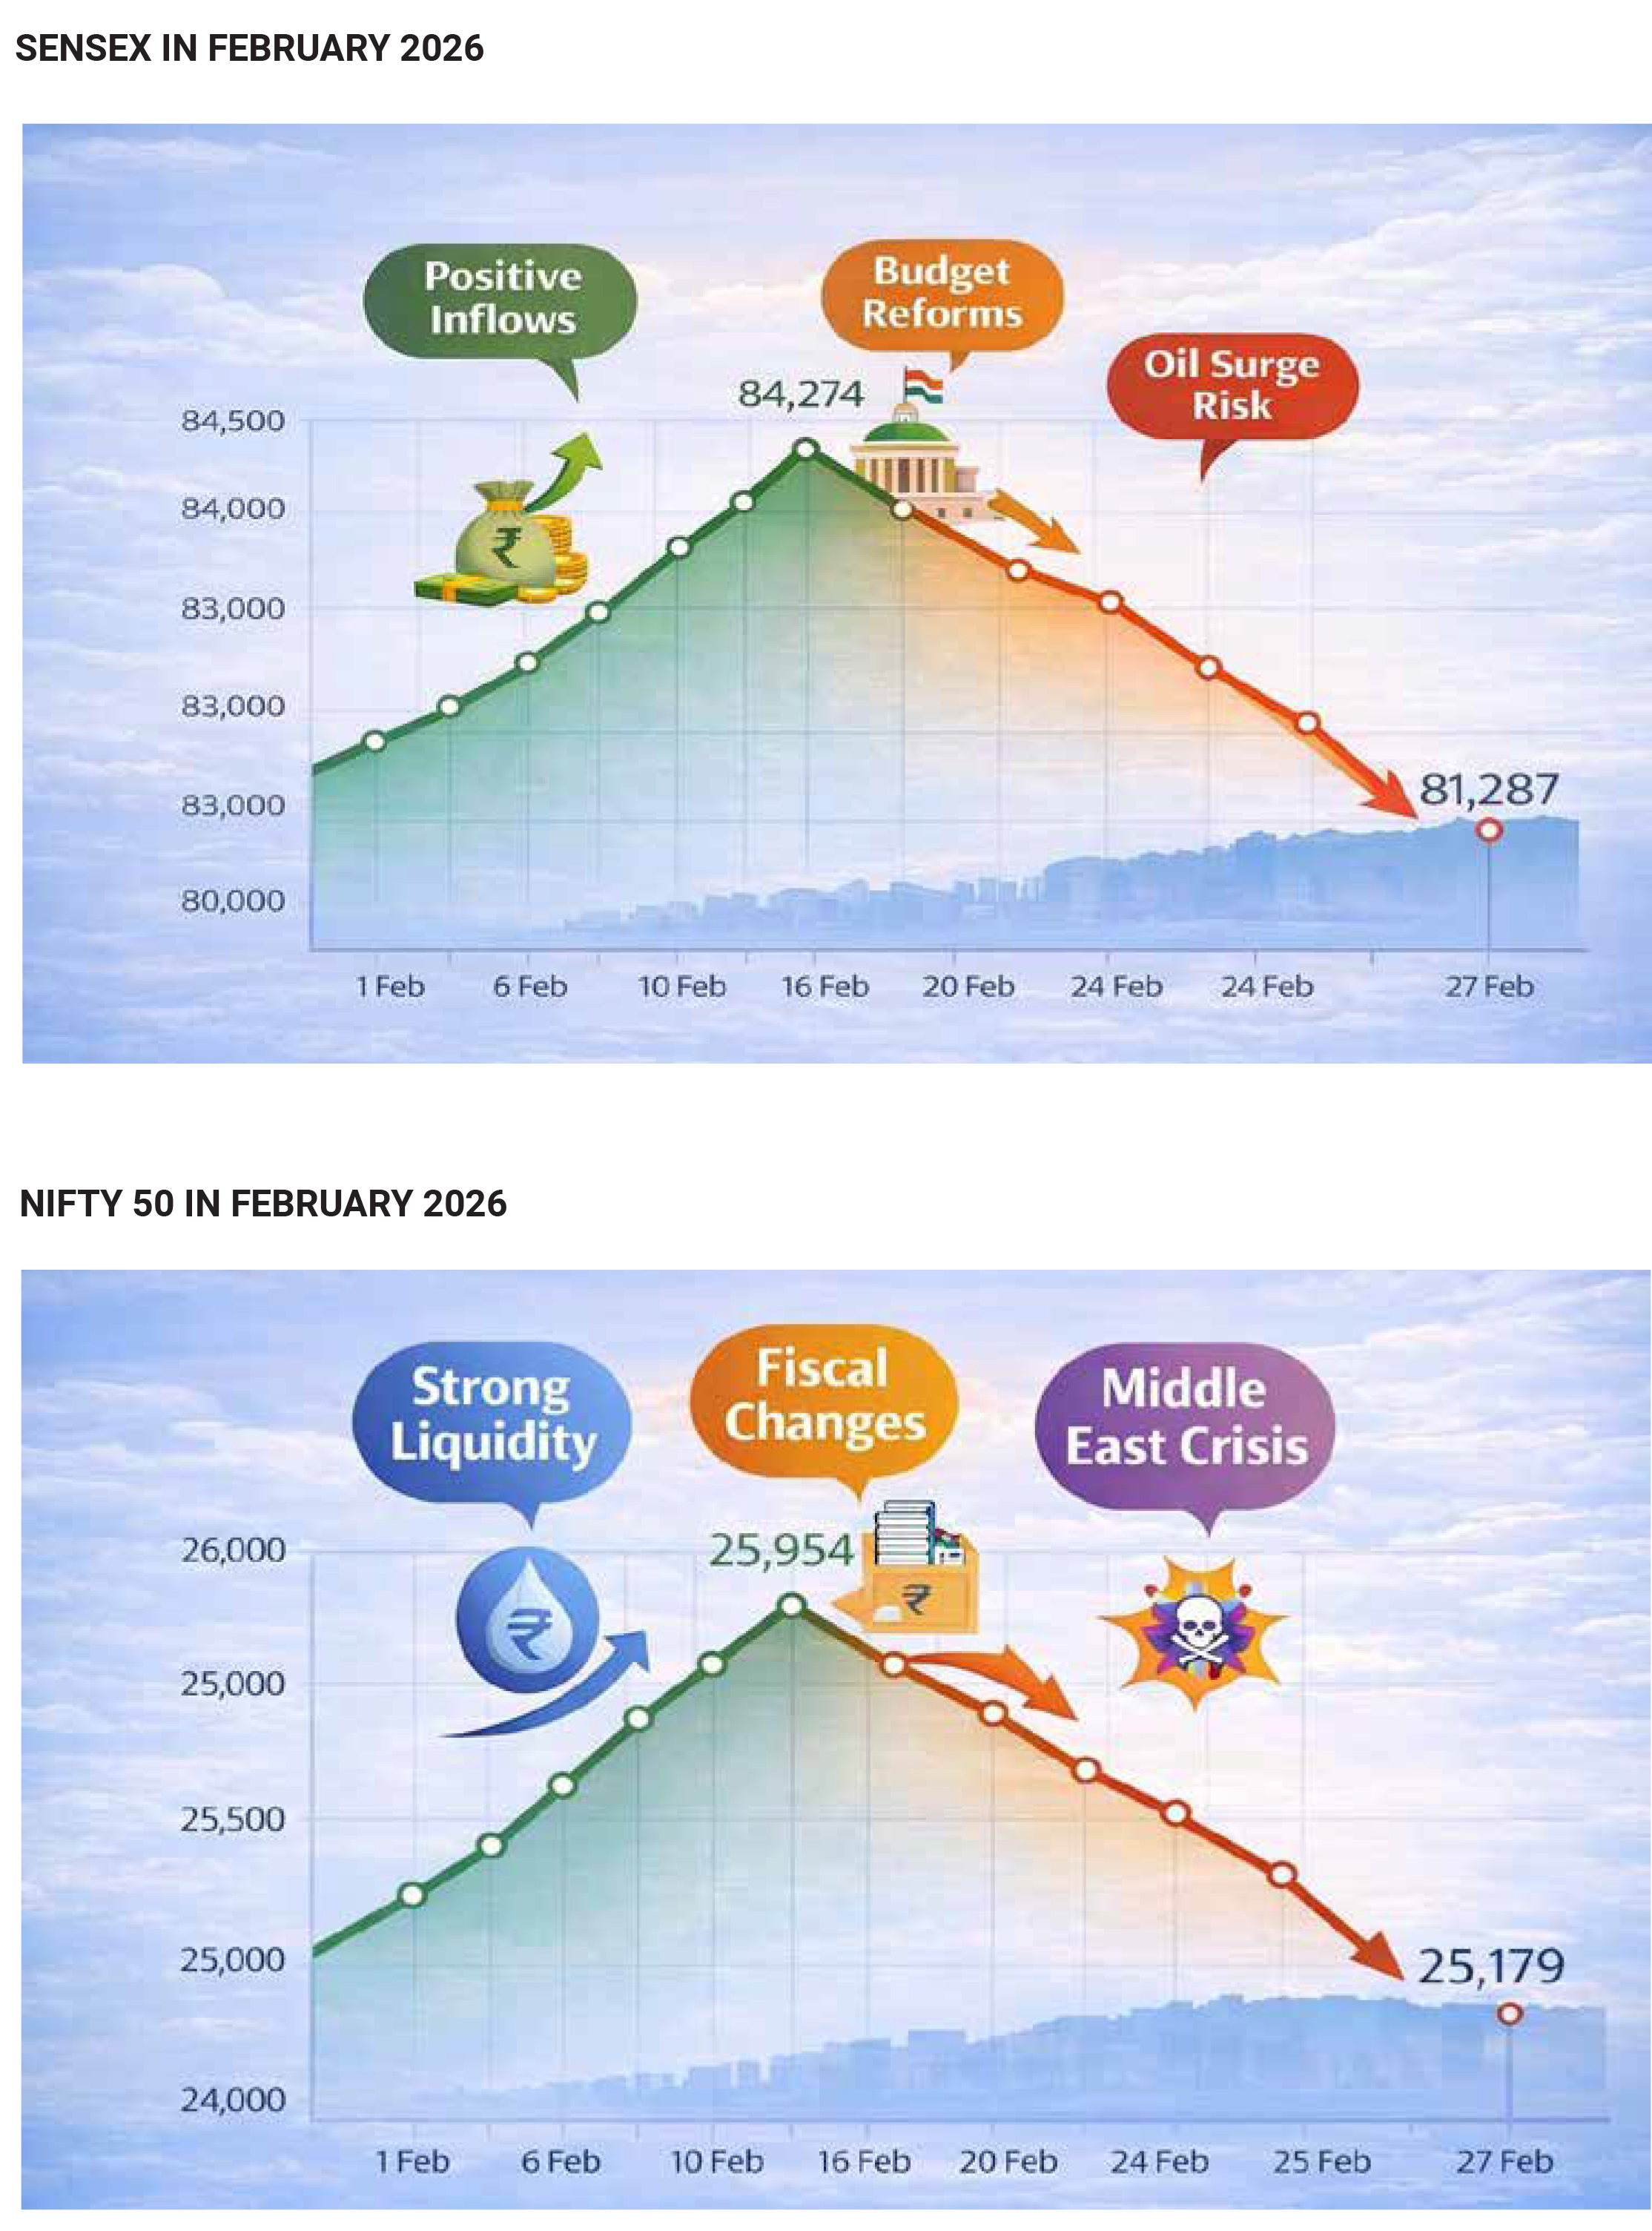
The benchmark began February on a strong footing,
buoyed by improved risk sentiment and renewed buying
interest. On 1 February, the index settled at 81,666.46
after a sharp jump, reflecting optimism around domestic
growth cues and foreign investor participation. However,
momentum soon tapered. Through mid-February, the
market traded in a tight consolidation band. By the week
ended 20 February, the Sensex had managed a marginal
weekly gain of just 0.23%, closing near 82,814.7. This
stability masked growing stress within certain
heavyweight sectors. By 27 February, the index had
drifted back toward the 81,300 zone, turning the month
marginally negative. On a calendar-year basis, the
Sensex was down about 2.8% by mid-month, reflecting
corrective pressure after the early January peak near
85,762. Despite February’s dip, the index remained
roughly 11% higher than a year earlier. The broader
12-month uptrend was intact. What February
represented was less a structural breakdown and more a
consolidation phase within a longer-term positive
trajectory.
The defining feature of February was the brutal selloff in
technology stocks. The NIFTY IT index plunged nearly
19.5% during the month — its steepest fall since the 2008
global financial crisis. Approximately ₹5.7 trillion in IT
market capitalisation was erased. Heavyweights faced
aggressive derating as concerns mounted that rapid AI
automation in the United States could disrupt traditional
Indian outsourcing models. Large exporters were hit
hardest, amplifying intraday swings in the broader
benchmarks given their significant index weights. The
market began reassessing growth visibility, pricing
power, and long-term competitive positioning for Indian
IT majors in an AI-driven global landscape
The second volatility catalyst came from the Union
Budget 2026, presented on 1 February. While the Budget
was growth-oriented in its macro framing, markets
reacted sharply to changes in derivatives taxation. The
Securities Transaction Tax (STT) on futures was raised
by approximately 150%, and on options by around 50%,
materially increasing trading costs. On Budget Day, the
Sensex plunged nearly 2% intraday, falling over
2,300–2,400 points from its peak and wiping out an
estimated ₹10–11 lakh crore in investor wealth in a
single session. The India VIX jumped roughly 11%,
reflecting an abrupt repricing of risk. Higher derivatives
costs triggered aggressive unwinding in index and stock
futures. Liquidity thinned temporarily as algorithmic and
high-frequency traders recalibrated positions. Brokerage
and capital-market-linked stocks saw sharp declines on
fears of lower F&O volumes and revenue pressure.
One of the most significant undercurrents in February
was the dramatic reversal in foreign portfolio investor
(FPI) flows. After three months of heavy selling — with
outflows of over ₹62,000 crore between November and
January — foreign investors turned decisive net buyers.
In February alone, FPIs infused approximately ₹22,615
crore into Indian equities, the strongest monthly equity
inflow in around 17 months. Including debt, total FPI
inflows crossed ₹31,000 crore. The shift was driven by
several factors: a growth-oriented fiscal stance, an
interim India–US trade agreement reducing tariff
overhang, softer-than-expected US inflation, improved
Q3 FY26 earnings growth of roughly 14.7% and lastly
valuation corrections after the late-2025 selloff.
However, flows were not uniform. While financials and
capital goods attracted buying, IT continued to see heavy
foreign selling — roughly ₹10,956 crore in February alone.
The message was clear: foreign capital was rotating, not
retreating.
Beyond domestic factors, global uncertainties added to
volatility. Rising tensions surrounding a US ultimatum to
Iran pushed oil prices above $70 per barrel, lifting the
equity risk premium. Late in the month, selling pressure
spread to private sector banks. Heavyweights such as
ICICI Bank, Kotak Mahindra Bank, and HDFC Bank
contributed significantly to a large single-day drop on 26
February. Given their combined weight in the index, even
moderate declines in these stocks amplified benchmark
weakness. At least five sessions during the month
recorded declines exceeding 1, underscoring the
elevated day-to-day swings.
Despite the noise, the structural underpinnings of the
market remained constructive. Earnings growth was
intact. Domestic macro indicators were stable. Capital
expenditure momentum continued. Foreign investors
returned selectively. February 2026 ultimately illustrated
a market transitioning from momentum-driven euphoria
to a more discriminating, fundamentals-driven phase.
The IT rout forced valuation recalibration. The
Budget-induced derivatives change reshaped trading
dynamics. Global tensions injected episodic risk
aversion. Yet capital did not flee — it rotated.
For market players, the key takeaway is that February’s
decline was not a systemic breakdown but a corrective
consolidation within a broader uptrend. With valuations
reset in select sectors and foreign flows stabilising, the
month may well be remembered as a volatility shock that
strengthened market structure rather than weakened it.
In equity markets, periods of discomfort often lay the
groundwork for more sustainable advances. February
2026 was one such chapter.
Indian debt markets navigated February 2026 with
resilience, delivering stable to slightly positive returns
despite heavy event risk. The month began with the
Union Budget 2026, which set the tone for bond trading
by combining record borrowing numbers with a
reaffirmed fiscal consolidation path. While the headline
borrowing figure initially made participants cautious, the
broader macro and policy signals helped benchmark
yields remain range-bound and slightly softer over the
month.
The Budget projected gross central government market
borrowing of approximately ₹17.2 lakh crore for FY27 —
higher than many dealers had pencilled in. This
immediately raised concerns about supply–demand
balance in government securities (G-secs). Elevated
issuance, alongside substantial state government
borrowing, suggested that rupee bonds could face
upward pressure on yields as the market absorbed the
borrowing calendar. However, the fiscal messaging was
equally important. The government reiterated a fiscal
deficit target of 4.3% of GDP for FY27, continuing gradual
consolidation from 4.4% in FY26 and signalling intent to
lower the debt-to-GDP ratio toward the mid-50% range
over time. This combination — near-term supply pressure
but credible fiscal glide path — produced a nuanced
reaction. Long-duration bonds faced mild bearish bias
due to heavier issuance expectations, but sovereign risk
perception remained contained. Term premia did not
expand sharply because markets interpreted the
borrowing within a disciplined macro framework rather
than fiscal slippage. Beyond headline borrowing, the
Budget also introduced structural measures aimed at
deepening the bond market. Proposals included a
market-making framework for corporate bonds,
derivatives on corporate bond indices, and total return
swaps to enhance liquidity and price discovery. While
these reforms did not immediately alter February pricing,
they reinforced the longer-term institutionalisation of
India’s debt markets, potentially supporting spreads and
attracting broader participation over time.
Shortly after the Budget, attention shifted to the February
monetary policy decision by the Reserve Bank of India.
The Monetary Policy Committee kept the repo rate
unchanged at 5.25% and retained a neutral stance,
signalling that the rate-cutting cycle — which had
delivered roughly 125 basis points of easing since early
2025 — had transitioned into a “hold and watch” phase.
The RBI underscored benign inflation, with CPI projected
around 4–4.2% in early FY27, alongside robust real GDP
growth expectations near 7%+. On policy day, bonds
initially sold off. The 10-year yield rose roughly 9 basis
points to about 6.74%, reflecting disappointment that the
RBI did not announce fresh bond purchases or additional
liquidity-boosting measures to offset the large
government borrowing programme. Traders had hoped
for explicit support through open market operations
(OMOs), especially given record issuance projections.
The absence of such measures triggered a brief tactical
rise in yields.
Yet this reaction proved temporary. By anchoring the
repo rate at 5.25%, maintaining the Standing Deposit
Facility (SDF) at 5.00% and the MSF/Bank Rate at 5.50%,
and signalling comfort with surplus system liquidity, the
RBI effectively stabilised expectations at the short end of
the curve. Liquidity remained ample, supported by prior
OMOs and FX swap operations amounting to several
lakh crore rupees. The message was clear: policy rates
were likely at or near the peak for this cycle, and macro
conditions were stable. This limited downside for bond
prices after the initial selloff.
As the month progressed, the 10-year benchmark yield
moved mostly within a tight 6.65–6.75% band, signalling
a stable to slightly firmer bond market even as equity
markets experienced sharp volatility. By 2 March 2026,
the 10-year G-sec yield stood near 6.70%, roughly 3 basis
points lower than a month earlier. This modest easing
translated into small price gains for benchmark bonds in
February — a respectable performance given the heavy
issuance backdrop and global uncertainties.
Foreign portfolio investor (FPI) behaviour provided
another layer of support. February saw consistent net
buying in Indian debt. In one weekly reading alone, FPIs
added approximately ₹5,139 crore to debt — among the
strongest weekly tallies in the current phase. Flow
analysis suggested that debt, rather than equities, was
the main driver of net foreign inflows during the month.
NSDL-based commentary repeatedly described “another
week of positive debt flows,” highlighting improving
foreign participation after earlier volatility. Several
structural factors underpin this foreign appetite. India’s
entry into major global bond indices has steadily
increased its visibility and weight in global fixed-income
portfolios. Additionally, relatively high real yields compared
to many emerging and developed peers make Indian G-secs
attractive in a world where inflation pressures are easing but
nominal yields remain compressed elsewhere. February’s
pattern — stable to slightly lower yields combined with solid
FPI buying — fits the broader narrative of gradual rerating,
where global investors use volatility episodes to build
structural positions.
Macro fundamentals stayed strong in early 2026, with real
GDP growth projected at 6.8–7.2%, contained inflation,
disciplined fiscal policy, and stable currency. Robust bond
auction participation demonstrated solid demand for rupee
debt. March saw yields edge higher due to technical supply
factors, not weakening fundamentals, highlighting
continued investor confidence in Indian debt markets.
Segment-wise, the implications were differentiated.
Long-duration and gilt funds experienced intermittent
volatility due to supply sensitivity and long-end yield
movements. In contrast, short-duration and corporate bond
funds benefited from stable short-term rates and attractive
carry. Anchored policy corridor rates helped money market
instruments and short-duration strategies deliver relatively
steady returns through the month.
In summary, February 2026 was a test of balance for Indian
debt markets. The Union Budget introduced record
borrowing numbers that initially unsettled sentiment, while
the RBI’s decision to hold rates without fresh bond
purchases caused a brief tactical spike in yields. Yet strong
macro fundamentals, credible fiscal consolidation, surplus
liquidity, healthy auction demand, and sustained FPI inflows
ensured that yields remained contained. The benchmark
10-year yield ended the month marginally lower, and debt
delivered modest gains. Rather than succumbing to supply
fears, the bond market demonstrated maturity and
structural depth. February’s performance underscored a key
theme for 2026: India’s debt market is increasingly
supported by institutional credibility, global integration, and
disciplined macro management — factors that together
helped it weather event-driven volatility and emerge
reasonably stronger.
February 2026 was one of the most turbulent months for
Indian bullion in recent memory, with the Union Budget 2026
acting as the immediate catalyst for extreme price swings.
The volatility was most visible on Budget Day, when both
gold and silver futures on MCX crashed sharply in intraday
trade before staging partial recoveries. While the broader
global backdrop contributed to the turbulence, the Budget’s
tax changes — particularly around Sovereign Gold Bonds
(SGBs) — triggered aggressive liquidation in leveraged
and “paper gold” positions, setting off a chain reaction
across bullion markets.
The key Budget announcement that unsettled the bullion
trade was the removal of capital gains tax exemption at
maturity for secondary-market buyers of Sovereign Gold
Bonds. Going forward, tax-free status would apply only to
original subscribers holding bonds until redemption. This
reduced the relative attractiveness of SGBs as a
tax-efficient alternative to physical gold and gold ETFs.
The move sparked profit booking in gold-linked financial
products and amplified selling pressure in futures, where
leveraged positions unwound rapidly.
On 1 February, MCX gold futures crashed over ₹10,000
per 10 grams and silver even more sharply amid record
pre-Budget highs, as policy surprises triggered a
technical selloff. Hopes for import duty reductions were
dashed, keeping gold and silver taxes unchanged, which
further hurt sentiment. However, this panic was brief. As
the month progressed, safe-haven demand and steadier
global markets supported a sharp recovery. By February’s
end, gold staged a V-shaped rebound, closing near
₹1,61,720 per 10 grams, with Delhi 24K gold up 0.6% for
the month, demonstrating buyers’ willingness to
accumulate on dips.
Silver, however, told a far more dramatic story. Spot
prices in India swung wildly, beginning near ₹3,50,000 per
kg on 1 February, collapsing to around ₹2,55,000 by 18
February, and then rebounding toward
₹2,85,000–3,00,000 per kg before consolidating into
month-end. The boom-bust-rebound pattern reflected
silver’s inherently higher beta nature. In corrections, silver
typically moves two to three times as much as gold, and
February followed that script precisely.
Silver’s sharper decline compared to gold in February
2026 was driven by several factors. Silver had seen an
outsized rally, with prices multiplying over the past two
years, resulting in stretched technicals and heavy
speculative positions fuelled by AI-related industrial
demand, supply concerns in China, and robust ETF
inflows. When global precious metals corrected amid a
stronger US dollar and expectations of prolonged high
interest rates, silver led the sell-off. The SGB tax change
impacted both gold and silver, but thinner liquidity and
high futures open interest in silver accelerated margin
calls and forced selling, amplifying volatility. Gold,
meanwhile, held up better due to consistent safe-haven
demand as geopolitical tensions and equity volatility
increased. By late February, both metals stabilised. Gold
entered mild profit-taking near monthly highs, while silver
consolidated around ₹2,80,000–2,85,000 per kg, with
uniform pricing across cities reflecting reduced panic and
cleaner positioning.
In summary, February 2026 was defined by a
Budget-triggered shock that exposed overstretched
positioning in bullion, particularly silver. Gold endured a
sharp early fall but recovered to post a small net monthly
gain, reinforcing its role as a resilient hedge. Silver, by
contrast, experienced a violent boom-bust-rebound cycle,
reflecting its higher beta and speculative character.
Together, the two metals illustrated how policy surprises,
technical positioning, and global macro forces can converge
to produce extreme but ultimately self-correcting volatility in
commodity markets.
The Indian Rupee (INR) depreciated moderately against the
US Dollar (USD) in February 2026, weakening by around
0.5–1.3%. USD/INR started the month near 90.70–90.75
and gradually rose, reaching 91.30–91.59 by early March.
This decline was measured, staying well below January’s
peak of 92.29, and reflected a controlled adjustment rather
than abrupt volatility. The weakening rupee was primarily
driven by global dollar strength. The US dollar index (DXY)
firmed as the Federal Reserve adopted a cautious
“higher-for-longer” rate outlook, with fewer expected cuts in
2026. Elevated US real yields and speculation about a more
hawkish policy stance further bolstered the dollar.
Consequently, emerging market currencies including the
rupee faced sustained external pressure. Despite
intermittent foreign inflows that provided brief support, the
overall trend was towards gradual depreciation, highlighting
how global monetary policy shifts and strong US yields
shape currency movements in India.
Domestically, the Union Budget 2026 added another layer of
caution. The government’s announcement of record gross
market borrowing of around ₹17.2 trillion for FY27 triggered
concerns about fiscal supply, current account pressures,
and sustained dollar demand from importers. While the
Budget reaffirmed fiscal consolidation targets, the scale of
borrowing heightened expectations of continued foreign
currency demand, particularly from oil marketing companies
and large importers hedging exposures. With crude oil
trading above $70 per barrel for much of the month,
India’s oil import bill remained elevated, structurally
increasing dollar demand in the domestic forex market.
Foreign portfolio investor (FPI) flows presented a mixed
dynamic. Although FPIs were net buyers of Indian
equities to the tune of roughly ₹22,000 crore during
February, overall forex demand remained tilted toward
the dollar. Debt inflows, oil-related payments, and
safe-haven positioning amid Middle East geopolitical
tensions kept underlying USD demand firm. Additionally,
higher US yields marginally reduced the relative carry
attractiveness of rupee-denominated assets, even
though the Reserve Bank of India’s repo rate stood at
5.25%. This dynamic limited the positive impact that
equity inflows might otherwise have had on the currency.
Stabilising forces, however, were equally important in
containing the rupee’s downside. The Reserve Bank of
India maintained a steady monetary policy stance in
February, keeping the repo rate unchanged at 5.25% and
signalling liquidity comfort. System liquidity remained in
surplus, anchoring short-term rates and supporting
investor confidence in macro stability. Market
participants widely believe that the RBI conducted
calibrated interventions in both spot and non-deliverable
forward (NDF) markets — potentially in the range of
$5–10 billion — to prevent excessive volatility. These
actions appeared effective in defending the 91.50–92.00
zone, ensuring that depreciation remained gradual and
contained rather than abrupt.
As a result, USD/INR traded within a relatively tight
monthly range of approximately 90.65–91.60, a notable
contrast to the sharper swings observed in equity and
commodity markets during the same period. Compared
to several Asian peers such as the Korean won or
Indonesian rupiah, the rupee demonstrated relative
resilience, reflecting India’s stronger macro
fundamentals, steady growth outlook, and proactive
central bank management. In essence, February 2026
was characterised not by rupee instability, but by
controlled depreciation shaped by global dollar strength,
fiscal supply optics, and oil dynamics — offset by credible
policy and vigilant intervention that kept currency
volatility firmly in check.
In February 2026, crude oil markets were dominated by a
Reserve contributed to a more cautious risk environment
in financial markets, amplifying volatility across equities
and fixed income.
For India, the crude price surge carried particular
importance given the country’s heavy reliance on
imported oil. A sustained climb toward $78 per barrel
from sub-$70 levels translated into higher import bills,
pressure on the current account deficit, and incremental
inflationary pressure on fuel and transportation costs. As
Brent remained elevated, many Indian refiners and oil
marketing companies faced margin compression on the
downstream side even as upstream producers saw
improved realisations.
In summary, February 2026’s crude oil price action was
dominated by a complex interplay between geopolitical
risk and market positioning. Fear of disrupted supplies
through strategically vital routes like the Strait of Hormuz,
coupled with an ongoing conflict environment, pushed
prices significantly higher over the month. Attempts by
OPEC+ to bolster production and sporadic diplomatic
optimism offered limited relief, but they were not enough
to counter the dominant narrative of supply risk. Brent’s
march toward the high $70s illustrated how geopolitical
catalysts can override fundamental supply and demand
considerations in the short term, embedding a
pronounced risk premium that reverberated through
commodity, currency, and equity markets alike.
On 26 February 2026, the Securities and Exchange Board
of India (SEBI) unveiled a landmark reform of mutual fund
categorization—reshaping an ₹81 lakh crore industry with
sharper definitions, tighter risk controls, and a brand-new
product category. At the heart of the overhaul is
simplification. Schemes are now consolidated into five
broad buckets: Equity-Oriented, Debt-Oriented, Hybrid,
Life Cycle Funds (new), and Other Schemes (Index Funds,
ETFs, and Fund of Funds). In a major shift,
solution-oriented schemes such as retirement and
children’s funds have been discontinued for fresh inflows
and will merge into comparable categories with
unitholder approval.
Equity schemes face stricter norms. Dividend Yield,
Value, Contra, and Focused funds must now hold a
minimum 80% in equities—up from 65%—ensuring
clearer “true-to-label” positioning. The remaining
allocation can include gold and silver ETFs, REITs, and
InvITs, offering measured diversification. Hybrid funds
have also been precisely defined, from Conservative
Hybrid (10–25% equity) to Aggressive Hybrid (65–80%),
while Multi-Asset funds must allocate at least 10% each
across three asset classes.
Perhaps the most significant structural reform is the 50%
portfolio overlap cap within the same fund house. Value
and Contra funds cannot mirror each other beyond this
threshold, and sectoral/thematic funds must reduce
overlap with other equity schemes in phased compliance
over three years. Monthly public disclosures will further
enhance transparency.
The headline innovation is the introduction of Life Cycle
Funds—open-ended schemes with fixed tenures (5–30
years) and automatic glide paths. These funds begin
equity-heavy and gradually shift toward debt as maturity
approaches, aligning risk with investors’ life stages. With
graded exit loads and disciplined asset transitions, they
aim to reduce emotional investing and simplify
long-term planning.
Implementation begins immediately, with phased
compliance through 2029—marking one of the most
comprehensive mutual fund reforms in recent years.