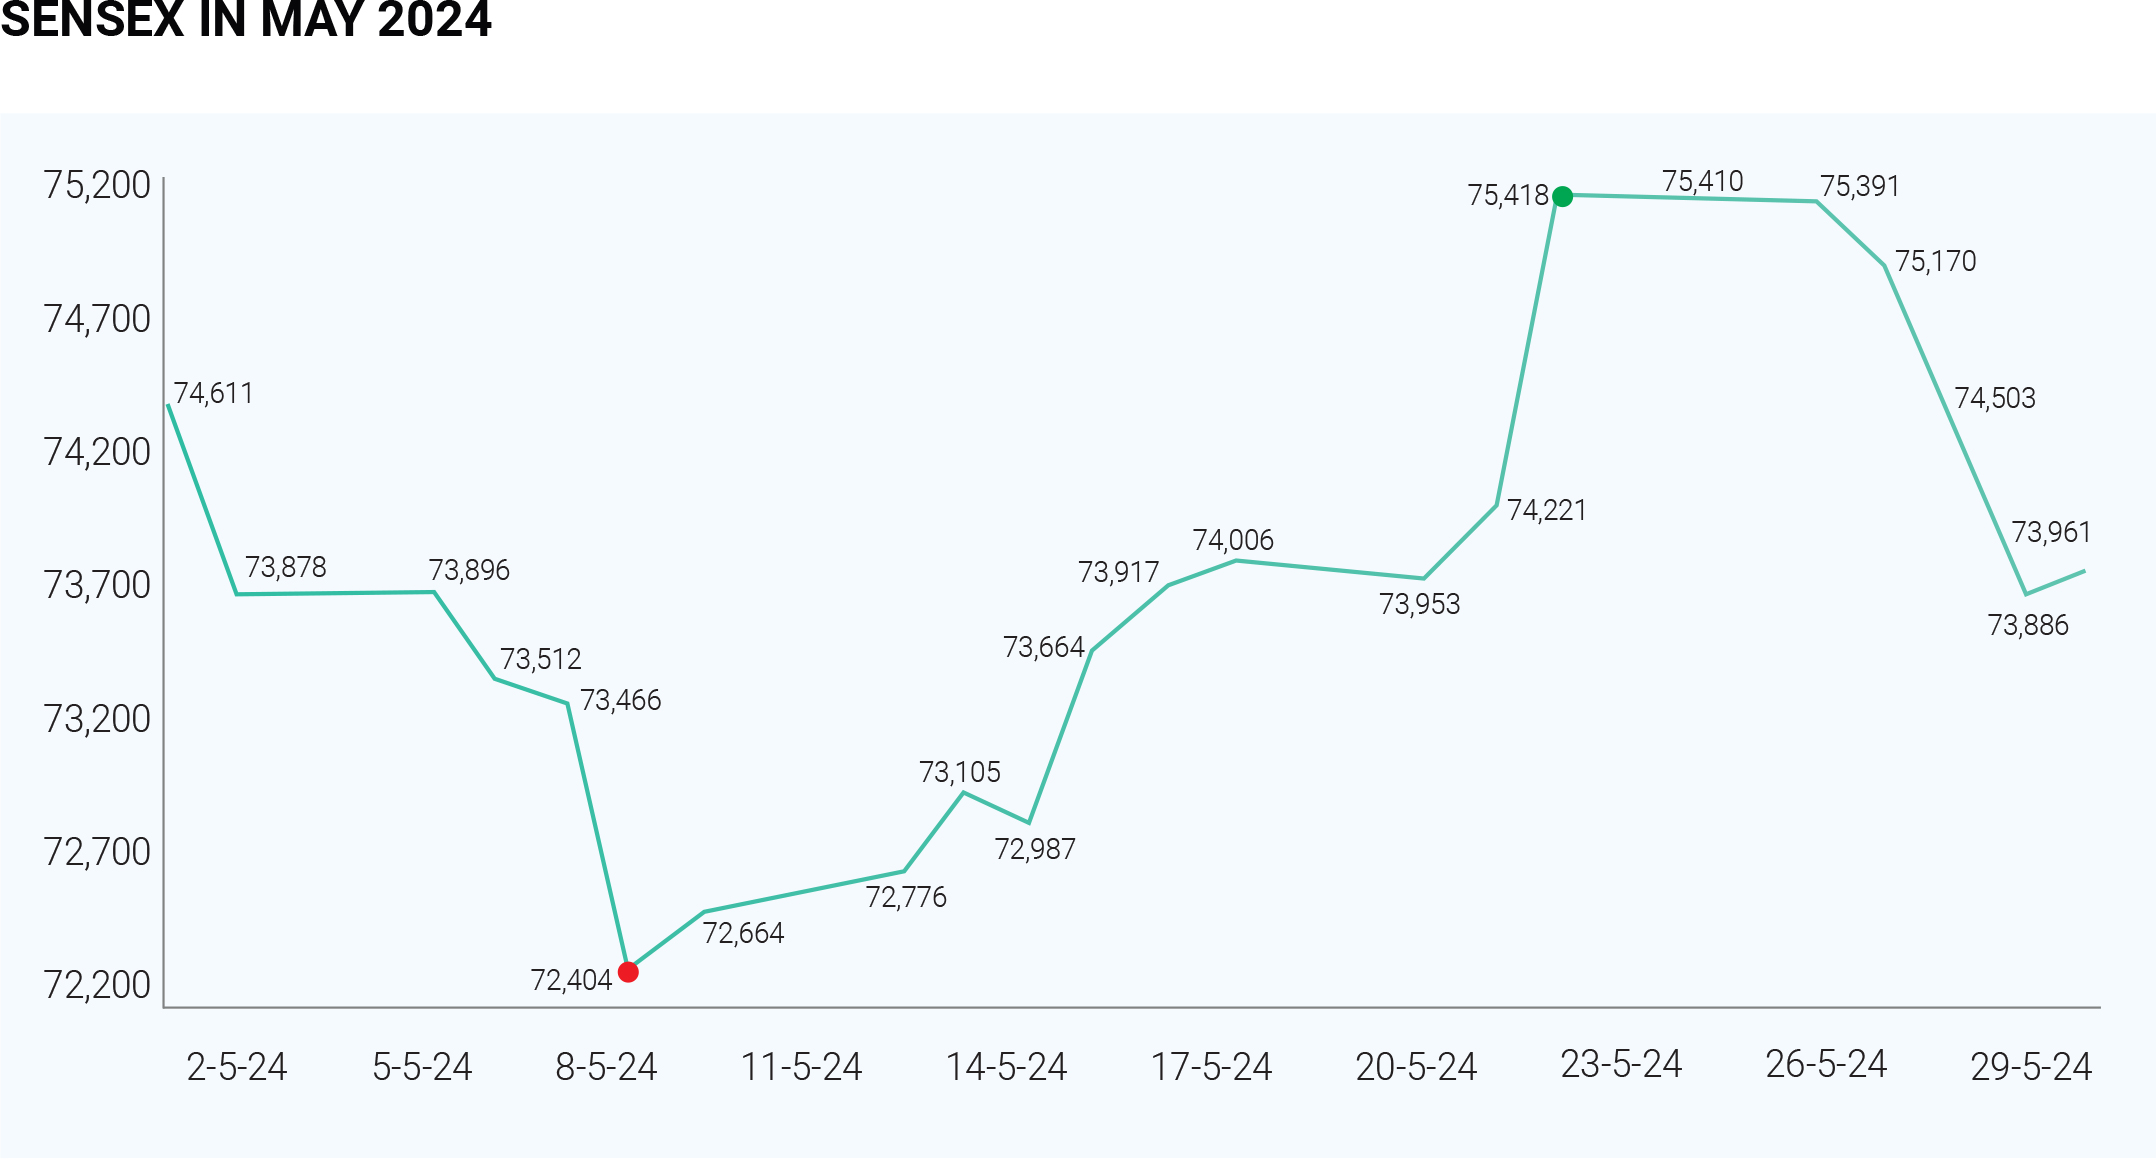
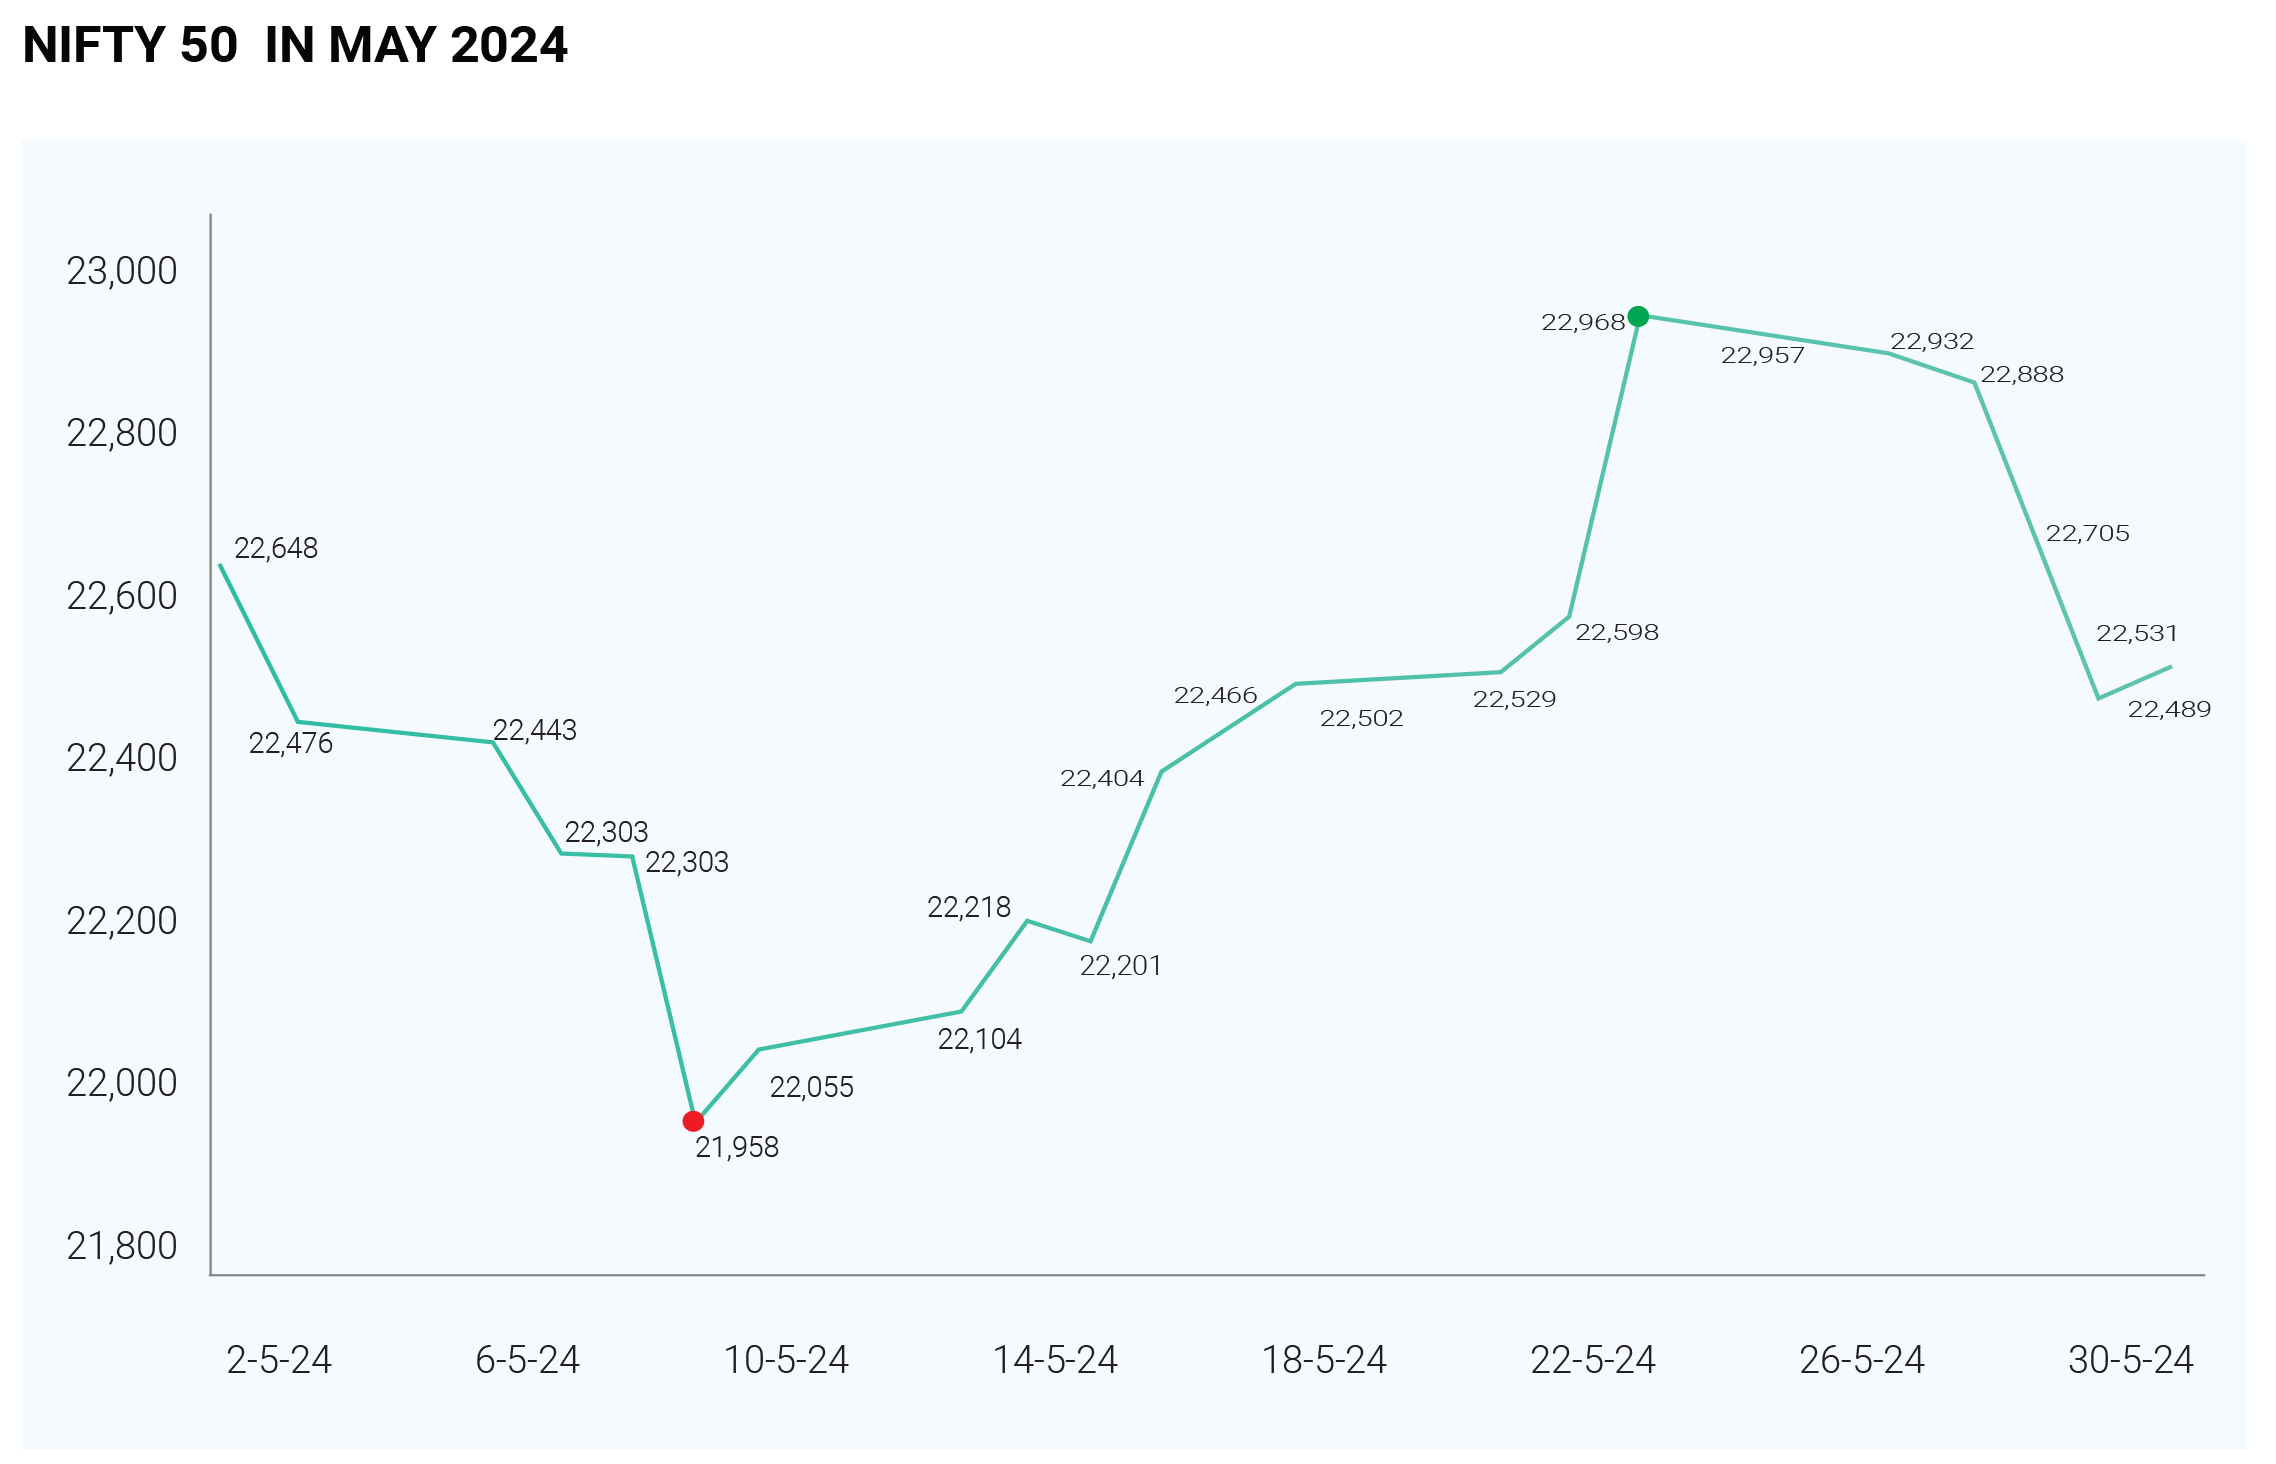
The Indian stock market concluded May 2024 on a lacklustre note, with major indices like Sensex and Nifty consolidating within a narrow range. The broader market also lacked momentum, reflecting investor caution. On May 30th, Sensex closed at 74,095.92, down 0.55% (407 points) after opening marginally lower (0.18%) at 74,356.90. Nifty 50 hovered around the 23,000 mark but ended the month slightly below 22,900 with a minor loss.
Many factors contributed to the muted performance like
weak global signals, volatility of F&O monthly expiry,
escalating geopolitical tensions in West Asia, ongoing
election jitters, and lastly the negative advance-decline
ratio and stock-specific corrections indicated the weak
market breadth, indicating a lack of widespread
participation.
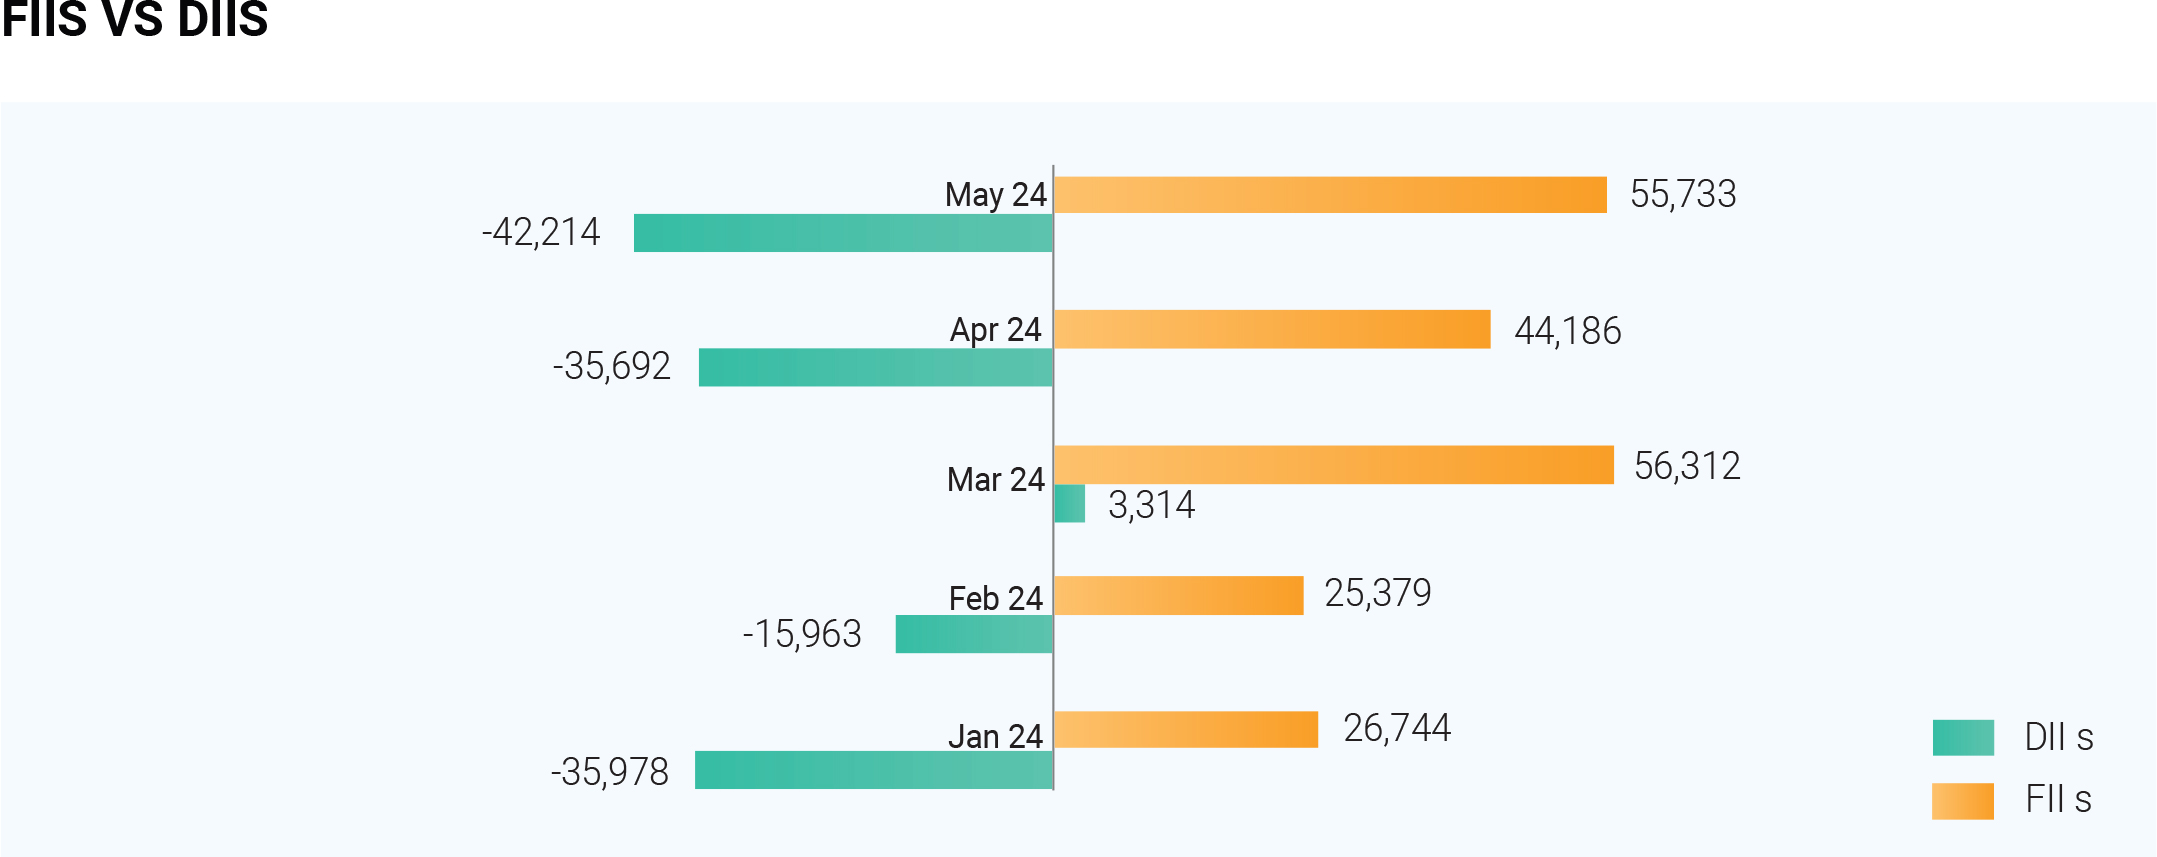
As the FIIs Pull back domestic investors supported the
market. Despite a positive underlying trend, the Indian
market witnessed significant foreign selling in May
2024.This aligns with the "Sell in May and go away"
adage, with FIIs offloading Rs. 25,600 crore worth of
Indian stocks. This shift likely reflects portfolio
rebalancing ahead of the upcoming Lok Sabha elections
results. FIIs dramatically increased their short positions
on May 30th, jumping from 5,000 contracts to a
staggering 2.97 lakh contracts in a single day. Concurrently, their long positions shrunk by 80%, representing the largest net outflow since January 2024. This selling extends beyond India, with FIIs pulling funds from other Asian markets as well. Domestic institutional investors (DIIs) provided counterweight to the FII selling, consistently buying Indian equities and upholding market support. The reason why FIIs are pulling back can be attributed to strong performance of Chinese stocks, increasing US bond yields, relatively high valuations of some Indian sectors, like financials and IT, and lastly disappointing earnings reports in certain sectors. However, the outlook is not entirely bleak. A stable outcome from the elections, coupled with India's strong GDP growth, manageable inflation, and potential for a pause in monetary tightening by the RBI, could entice FIIs to return as buyers.
Large-cap stocks largely followed the broader market
trend, rising by about 0.18% on May 30th, nearly matching
the Nifty 50's performance. The real estate and utilities
sectors were the key drivers of gains within large caps.
Notably, the real estate sector has delivered impressive
triple-digit returns year-to-date (FY24). Mid-cap stocks
emerged as the outperformers, with the Nifty Midcap 100
index surging by a significant 59% in FY24. Small-cap
stocks also witnessed strong gains, with the Nifty
Smallcap 100 index climbing 69% year-to-date.
May 2024 offered a mixed picture of the Indian economy.
While positive signs emerged in sales revenue and GDP
growth, profit performance and political uncertainty
presented challenges. Sales revenue growth in Q4 was
encouraging, exceeding growth in previous quarters. This
upswing, largely driven by the banking sector, suggests a
pick-up in business activity. Despite the sales growth,
profits lagged due to cost pressures and banks facing
difficulties in thinner markets. A bright spot was Q4's GDP
growth of 7.8%, exceeding market expectations of 6.5%.
This indicates a robust and growing economy. Current
political landscape likely caused investor caution and
contributed to market volatility.
The Indian bond market enjoyed a welcome rally in May
2024, fueled by a combination of positive domestic and
global factors. A stronger fiscal position at home, coupled
with reassuring news about inflation abroad, boosted
investor confidence. However, concerns lingered about
the potential for rising U.S. yields to dampen the positive
momentum. The rally saw yields on Indian government
bonds (IGBs) decrease by 12-15 basis points (bps).
Notably, the benchmark 10-year yield dipped below the
psychologically important 7% mark, a boon for investors
seeking stable returns.
The Indian rupee enjoyed a two-month high in May 2024,
closing at its strongest level since March 19th. On May
26th, it settled at 83.0975 against the U.S. dollar. This
appreciation was influenced by global factors, including
movements in U.S. bond yields and the Federal Reserve's
monetary policy decisions.
Gold prices in India, however, presented a mixed picture in
May. While the price of 10 grams of 22-carat gold
fluctuated throughout the month, it closed at Rs. 67,888
on May 31st, compared to Rs. 65,908 on May 1st.
Analysts anticipate a potential rise in gold prices in the
coming quarters, driven by factors like global economic
uncertainty and the upcoming festive season, which
typically sees a surge in gold demand.
In May 2024, crude oil prices experienced a decline, as on
May 28, 2024, the Brent crude oil price stood at $84.23 per
barrel, compared to $79.83 for WTI oil. The Brent July
contract closed at $81.62 per barrel, a decrease of 24
cents or 0.29%. Factors contributing to the decline in oil
prices includes – health of global economy and oil
demand, easing Middle East tensions, sluggish oil
demand and expectation of prolonged high interest rates.
However, OPEC+ is expected to extend its ongoing
voluntary output cuts of 2.2 million barrels per day at its
upcoming meeting, which could increase the price.
The Indian markets in June 2024 are expected to be
influenced by several factors, including the outcome of
the general elections, monetary policy decisions, and
global economic trends. A stable government, cautious
monetary policy, and positive global economic trends
could lead to increased investments and a positive
market outlook.
India Volatility Index, India VIX, a measure of risk for the
investors, has rosed 91% in May 2024, which is second
highest monthly jump since March 2020. India VIX what
actually calculates and why it is important for investors is
still a enigmatic. If the current India VIX is at 25, that
indictaes the NIFTY 50 is expected to fluctuate within a
range of 25% either way up or down over a period of one
year from the today’s mark. So lets understand the India
VIX in detail as it has proven to be a good measure for risk
averse investors over past few years.
The India VIX, is calculated by the National Stock
Exchange (NSE) using the best bid and ask quotes of the
out-of-the-money near and mid-month NIFTY option
contracts traded in the F&O segment of the NSE. The India
VIX is a numerical representation of market expectations
regarding short-term volatility, typically over the next 30
days. The India VIX is derived from the option prices of the
NIFTY 50 index, using the Black & Scholes model, which
considers variables like strike price, market price of the
stock, time to expiry, risk-free rate, and volatility. The strike
price (K) represents the pre-determined price at which
options on the Nifty 50 index are exercisable. For the India
VIX calculation, this value is determined based on the
out-of-the-money call and put options of the Nifty 50
index. The market price of the stock (S), this variable
denotes the current market price of the Nifty 50 index, and
it is usually the latest available price. Time to expiry (T)
refers to the remaining time until the options on the Nifty
50 index expire. For the India VIX, this period is generally
set to 30 days, as the index aims to measure short-term
volatility. The risk-free rate (R) is the interest rate offered
on risk-free investments, typically represented by
government bonds. It serves as a benchmark for
comparison, and in the context of the India VIX
calculation, it is often the yield on the government bonds
with a corresponding time to maturity (30 days). And
lastly the Volatility (σ), this is the most critical variable in
the India VIX calculation.
The calculation methodology for India VIX is a
combination of option quotes and variance, where option
quotes are the best bid and ask quates of
out-of-the-money near and mid-month NIFTY option
contracts traded in F&O segment of Nifty. Variance
(volatility squared) is computed separately for near and
mid-month expiry. The variance is computed by providing
weightages to each of the NIFTY option contracts
identified for the computation, as per the CBOE method.
The weightage of a single option contract is directly
proportional to the average of best bid-ask quotes of the
option contract and inversely proportional to the option
contract’s strike price. Then this variance for the near and
mid-month expiry computed separately are interpolated
to get a single variance value with a constant maturity of
30 days to expiration. Finally, the square root of the
computed variance value is multiplied by 100 which gives
the valye of India VIX. Hence the India VIX is a numerical
representation of market expectations regarding
short-term volatility. A higher India VIX indicates greater
anticipated volatility, reflecting the market's expectation
of sharp movements. Conversely, a lower VIX level
suggests lower volatility and a more stable market
environment. It represents the expected degree of price
fluctuations in the Nifty 50 index over the next 30 days.
Historically, India VIX and NIFTY have exhibited a strong
negative correlation. When India VIX rises, NIFTY falls,
and vice versa. This means that a higher VIX often
corresponds to a bearish market sentiment, while a lower
VIX indicates increasing confidence among traders.
How the traders and investors benefits from India VIX? In
past few years it has become an important tool to
measure the risk for the portfolio and fund managers to
determine the beta exposure and deciding factor for the
option traders. India VIX futures contracts are available
for trading, allowing investors to hedge against short-term
volatility. The India VIX index is also used to price
derivative contracts and premium. The range in which the
India VIX moves is between 15-35 but it can also breach
lows and high values under certain circumstances. The
India VIX affects stock prices by influencing investor
confidence and expectations of market volatility. A higher
VIX can lead to increased uncertainty and potentially
lower stock prices, while a lower VIX can indicate greater
stability and potentially higher stock prices. Historically,
India VIX and NIFTY have exhibited a strong negative
correlation. When India VIX rises, NIFTY falls, and vice
versa. This means that a higher VIX often corresponds to
a bearish market sentiment, while a lower VIX indicates
increasing confidence among traders.
The India VIX has been closely watched by the fund
managers and traders to guage the volatility ahead of Lok
Sabha election results. As in the month of May 2024 India
VIX has been very volatile phase toucjhing all time high of
91%. There are various factors which contribute to the
volatility of the Index. Firstly, the economic numbers like
GDP, Inflation rate and employment affects the market
volatilty and hence the India VIX index, strong numbers
increases confidence and lower down the volatility, while
weak data causes uncertainty and high volatilty. Secondly,
geopolitical events like wars, international conflicts or
election season affects the India VIX as it effects the
uncertainity and thus increases the volatility. These
events lead to major shift of investors to the safer
investments thereby affecting the market volatility. Third
factor which affects the India VIX is corporate
announcements like mergers and acquisitiion, earnings,
regulatory changes and other news which effects the
profits of the company. Positive news lead to lower
volatility and increased investor confidence, while
negative news causes uncertainity and high volatility.
Fourth one is interest rate movements which affects the
cost of borrowing and hence the market sentiments.
Higher interest rate high volatility and lower interest rate
contributes to stable market. Fifth factor which influence
the India VIX is retail investor behaviour, markets are
driven by buying and selling decisions of the retail
investors. Retail investors' preferences for
out-of-the-money options can lead to fluctuations in the
VIX, particularly during times of high market uncertainty.
Lastly, futures and options trading, forward index levels
determines the strike option of the options contract,
which is the current market price of NIFTY 50. This
forward index level is used to measure volatility for next
30 days. Also the Bid-Ask prices are used to calculate the
India VIX. Options market dynamics like trading volume,
open interest and the patterns of buying and selling, has
an impact on India VIX and hence the market volatility. So
as a result all volatilty factors collectively contribute to the
India VIX movements, and thereby providing the traders
and investors a valuable information to traders and
investors to make informed investment decisions.
India VIX has been volatile in May due to various factors,
primarily related to the ongoing Lok Sabha elections. The
index has risen by around 53% so far in May, with the
current price at 24.6. This surge in volatility is attributed to
the concerns over the election results, which are expected
to be declared on June 4. The market participants are
cautious due to the potential impact of the election
outcome on the BJP's seat count, and foreign portfolio
investors have been selling Indian equities, leading to a
decline in the domestic market. Lok Sabha elections tend
to increase India VIX volatility due to uncertainty around
results, with the index often spiking around result days.
The market's reaction depends on whether the outcome
was anticipated, and global factors can also influence the
India VIX during election periods.
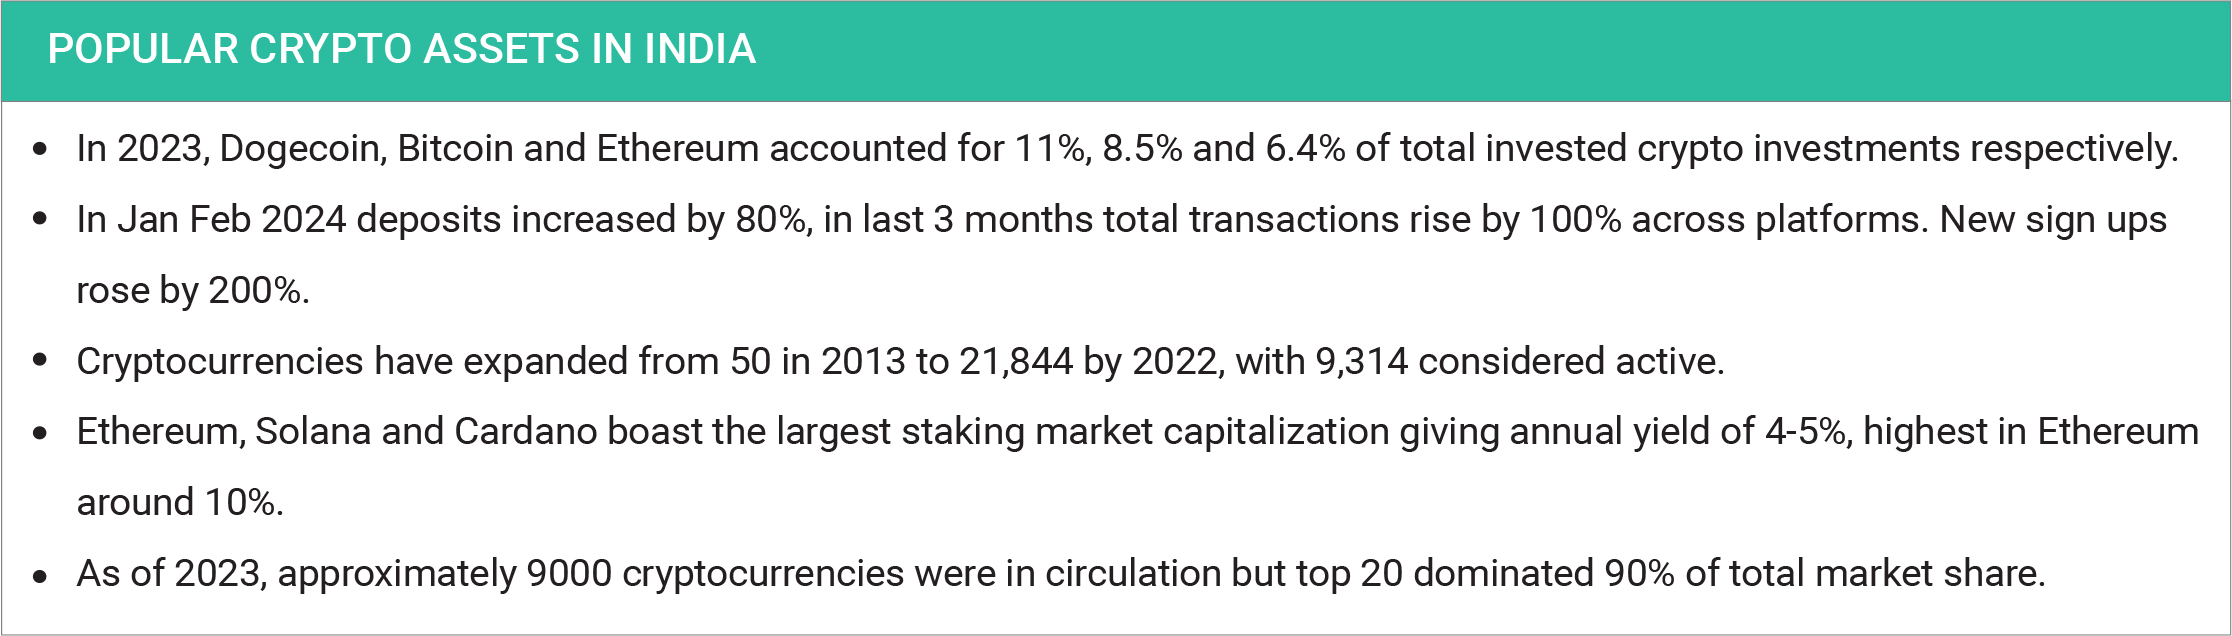
Several countries have banned cryptocurrency
altogether, including China, Bangladesh, Egypt, Morocco,
Nepal, Iraq, Tunisia, and Qatar. While India doesn't
currently have a law in place specifically banning crypto,
the Cryptocurrency Bill 2021 is still under development.
In the meantime, the government has begun taxing
virtual assets as part of the 2022 Union Budget
Few terminologies of Cryptocurrency world: FUD (fear, uncertainty & doubt) : A strategy used to influence people’s perception of crypto through the spreading of negative, misleading or false information. Halving : It is a process that reduces the number of new coins created in a cryptocurrency’s blockchain. Mining rigs : They are specialized computers, customized for cryptocurrency mining. A miner is used to help process transactions and secure the network of a cryptocurrency that uses a Proof-of-Work algorithm. When Lambo : the point at which crypto holders will be rich enough to buy a Lamborghini. Flash Crash : When the price of an asset drops drastically in a short period of time and then returns to the previous levels in the same amount of time.
A 2023 report found that millions of Indian crypto users (3-5 million) have switched to foreign exchanges, taking $3.8 billion in trading volume with them. This shift is attributed to India's high crypto taxes (1% TDS and 30% capital gains tax with no loss offsetting). To effectively regulate crypto, policymakers need to recognize it as a financial asset.